50–200 SKU Pilot: Clothing Size Conversion for Shopify Dropshippers
Automate bulk clothing size conversion for Shopify dropshippers. Run a 50–200 SKU seven day pilot to create measurement based charts, reduce returns, and...
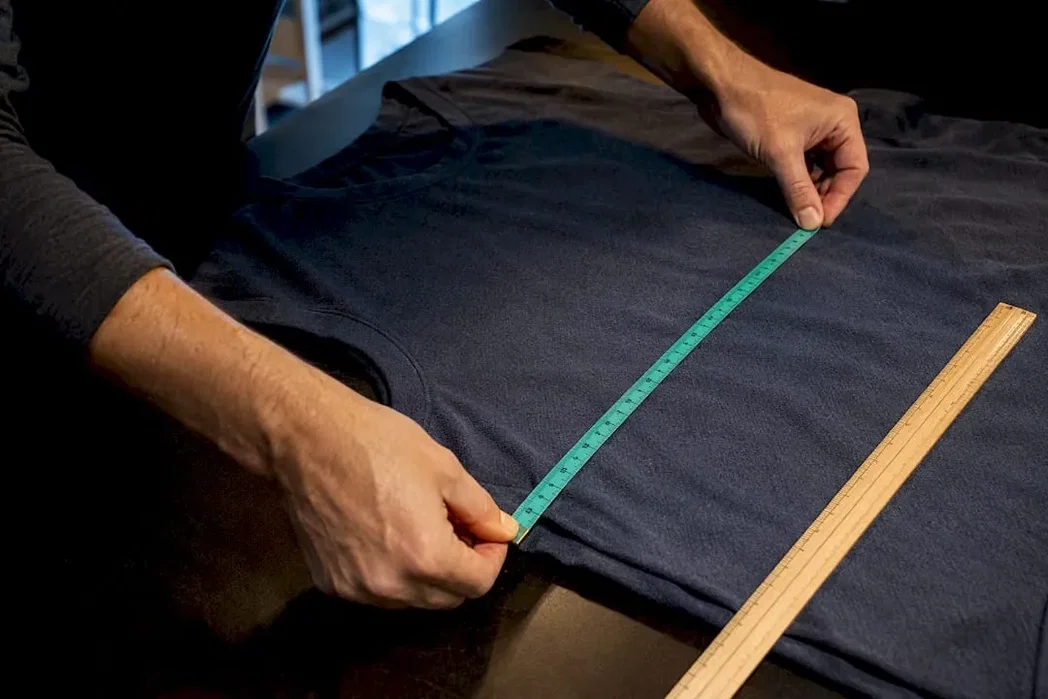
50–200 SKU Pilot: Clothing Size Conversion for Shopify Dropshippers
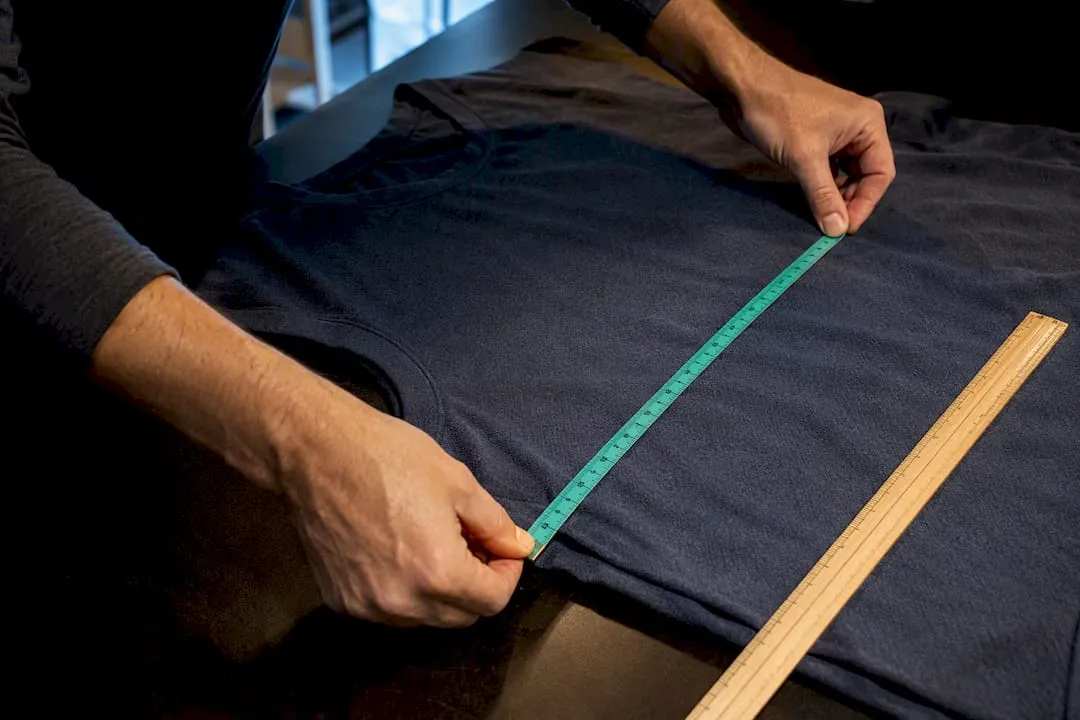
You automate bulk clothing size conversion by running product data through a single pipeline: ingest raw supplier measurements, normalise them into one canonical unit system, generate multi-market size charts with AI, then map and export the results straight to Shopify. The essential capabilities are bulk import, unit conversion (cm to inches and back), automatic mapping across US, UK, EU, Japanese and Korean size labels, and direct assignment to product variants. A tool packages most of this into one workflow.
TL;DR:
- Most sizing errors originate from inconsistent supplier charts and regional differences, leading to high return rates and customer dissatisfaction.
- Automating size conversion involves six structured stages, including data ingestion, normalization to centimeters, and AI-powered scaling for large catalogs.
- Verifying measurements against physical garments and implementing a strict QA process significantly reduces errors before full-scale deployment.
- A pilot batch of 50 to 200 SKUs allows merchants to identify and correct mapping mistakes early, ensuring better accuracy and lower return rates.
- Incorporating fit descriptors and clear measurement instructions helps customers choose correct sizes, especially considering fabric stretch and garment ease.
Table of Contents
- Why systematised size conversion matters for dropshipping stores and SEO
- How do you automate bulk size conversion for Shopify?
- Size-conversion checklist and common catalogue-scale pitfalls
- How EcomEye supports this workflow at scale
- 7-day pilot plan: proving the workflow before you scale
- Tips for consumers on measuring themselves accurately for size conversion
- How does fabric stretch affect size conversion accuracy?
- What are the common challenges in clothing size conversions?
- How do you read body measurements versus garment measurements?
- What tools exist for manual and automated size conversion?
- Which international size systems does your catalogue need to handle?
- Koen’s perspective: three rules from scaling product pages
- Start a size conversion pilot with EcomEye
- Sources
- FAQ
Why systematised size conversion matters for dropshipping stores and SEO
Sizing errors are the single biggest driver of returns in apparel dropshipping, and every returned parcel eats into margin that was already thin. Supplier charts compound the problem: two AliExpress listings for what looks like the same hoodie can carry completely different measurements under an identical “L” label, so trusting the label instead of the tape measure is how return rates creep up quietly. Merchants who collect actual garment measurements and build their own charts cut that confusion at the source.
There’s a second payoff most merchants miss: unique, measurement-based size data doubles as unique content. Every SKU with its own verified chart becomes a genuinely distinct product page rather than a copy-pasted supplier description, which is exactly the kind of differentiation Google rewards.
- Reduced returns due to better matching of buyer’s body and garment measurements
- Distinct, SKU-specific content that avoids duplicate-content penalties
- A defensible size guide you control, rather than one that changes when the supplier does
- Lower support load, since customers stop messaging to ask “is this true to size?”
How do you automate bulk size conversion for Shopify?
Treat conversion as a data pipeline, not a one-off spreadsheet task. Six stages, done in order, turn a messy catalogue import into consistent, exportable size charts.
- Ingest the raw data. Pull measurements from CSV exports, AliExpress product pages, competitor Shopify links, or supplier APIs. Capture everything, even inconsistent supplier labels, because you’ll normalise it in the next step.
- Build a canonical measurement table. Store every garment in one unit, ideally centimetres, with fields for chest, waist, hip, inseam and length. This becomes your single source of truth, and every US, UK, EU, Japanese or Korean label gets derived from it rather than stored separately, which is the approach most operational guides on measurement-based size tables now recommend over keeping parallel labelled charts.
- Apply conversion and mapping rules. Set fixed rounding logic (nearest 0.5cm, for instance) and a mapping table that converts canonical measurements into each region’s labelled size. Lock this once and reuse it across every import, rather than rebuilding it per batch.
- Let AI handle the transformation at scale. Modern tools can parse a supplier’s screenshot or spreadsheet and turn it into structured rows automatically, then generate a multi-system size chart and even seed a fit-recommender quiz from the same data. This is where a 30 to 60 times throughput gain over manual entry typically shows up, because one person editing charts by hand simply can’t keep pace with a catalogue import of a few thousand SKUs.
- Assign charts to the right level. Attach the chart to the product handle or collection for shared sizing, but always map the specific converted size to the individual variant metafield. Get this wrong and you’ll have a chart that’s technically correct but sitting on the wrong T-shirt.
- Export and automate the push. Bulk CSV or API export to Shopify, with error handling that flags any row missing a measurement rather than silently publishing a blank chart.
Pro Tip: Run your conversion rules against five known reference garments before touching the full catalogue. If the maths holds for products you can physically measure, you can trust it at scale.
Verification closes the loop. Spot-check a sample of converted charts against the physical item where possible, track return rate by SKU category, and watch product-page conversion once the new charts go live. A 50 to 200 SKU pilot gives you enough signal to catch mapping errors before they hit the whole catalogue.
Size-conversion checklist and common catalogue-scale pitfalls
A handful of small errors, repeated across thousands of SKUs, produce most of the returns merchants blame on “sizing being hard.” Run this checklist before any bulk export.
- Verify measurements against supplier claims, don’t just copy them. Suppliers routinely mislabel garments, and this is the single biggest source of sizing inconsistency in dropshipping.
- Store centimetres wherever they’re available. Converting cm to inches is more reliable than reconstructing cm from a rounded inch figure.
- Lock variant-to-size mapping exactly. A swapped label between “M” and “L” on a single variant can silently misroute the wrong chart to the wrong buyer.
- Fix your rounding rule once and apply it everywhere. Inconsistent decimal handling across batches is a common cause of charts that look “close but wrong.”
- Test the size-chart UI on mobile. Most shoppers check sizing on a phone, so a chart that requires horizontal scrolling gets ignored, not read.
- Build a QA and flagged-fulfilment loop. Combining chart verification with customer feedback tracking and fulfilment spot checks catches outlier SKUs before they generate a wave of returns.
AI-generated pages with accurate fit data have been shown to lift on-page conversion by up to 34% when the underlying attributes, including size, are complete and audited before the automation runs. Skip the audit and you risk automating the errors, not just the workload.
How EcomEye supports this workflow at scale
EcomEye is built around the exact pipeline described above, rather than treating size conversion as an add-on. As an AI SaaS focused on scaling Shopify dropshipping catalogues, it automates the stages that eat the most manual hours:
- Bulk import from suppliers or competitor links to avoid retyping supplier data
- Size system conversion across standard regional systems, applied automatically during page generation
- Generation of unique, SEO-ready titles and descriptions per SKU to avoid duplicate-content issues
- Multi-language page generation for stores selling into multiple markets
- Export back to Shopify once charts and copy are ready
The practical approach is a pilot, not a full-catalogue leap. Run 50 to 200 SKUs through the workflow first, check a sample of the generated charts against real measurements, and watch return rate and product-page conversion for a week or two before expanding.
Pro Tip: Keep a human in the QA loop for the pilot batch specifically. Automation scales whatever you feed it, including mistakes, so catching them early costs far less than catching them after 5,000 SKUs are live.
Setup itself is quick. Most of the time investment goes into the initial mapping rules and the QA review, not the software configuration.
7-day pilot plan: proving the workflow before you scale
You don’t need a quarter to validate this. A tight week gets you a decision.
- Day 0 to 1: Audit a sample batch of SKUs and capture real garment measurements where you can get physical samples.
- Day 2 to 3: Build your mapping templates and lock the unit conversion and rounding rules you’ll reuse for every future import.
- Day 4 to 5: Generate size charts for the pilot batch, assign them to the correct variants, and publish to a staging store rather than live.
- Day 6: Place a handful of test orders and monitor for any fulfilment flags or mismatched sizing.
- Day 7: Check return rate and PDP conversion against your baseline, then decide whether to scale the batch size.
Tips for consumers on measuring themselves accurately for size conversion
Every automated chart is only as good as the measurements a customer takes to compare against it, so the guidance you put on the product page matters more than most merchants assume.
Tell buyers to measure with a soft tape, not a rigid ruler, and to measure over light clothing rather than bare skin, since bare-skin measurements tend to read slightly smaller. Chest or bust should be measured at the fullest point, keeping the tape level all the way round rather than sagging at the back. Waist measurement causes the most confusion: it’s the natural waistline, roughly at navel height, not wherever a pair of jeans happens to sit. Hip measurement should be taken at the widest point, usually a few inches below the natural waist.
Posture matters more than people expect. Standing naturally, arms relaxed, feet together, gives a consistent reading. Someone slouching or standing with legs apart can add a centimetre or two without realising it, which is enough to push a borderline measurement into the wrong size band.
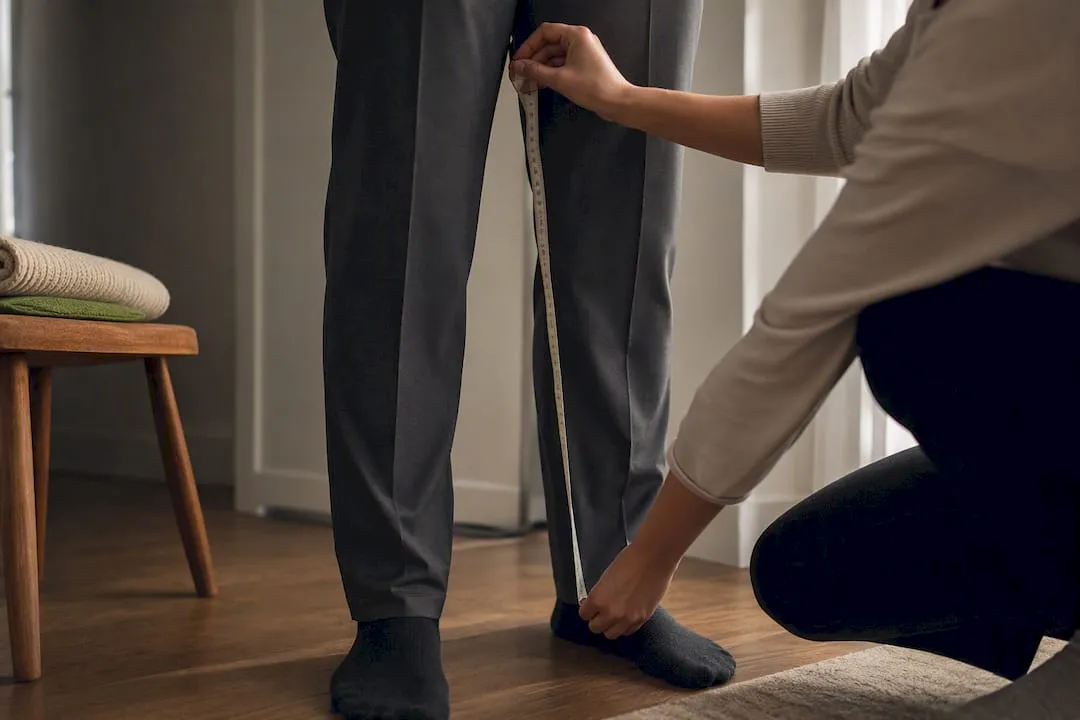
For inseam and length, having a second person measure is far more reliable than trying to read a tape wrapped around your own leg. If your size chart includes instructions this specific, and pairs them with a simple visual diagram showing exactly where to place the tape, you’ll cut mismeasurement-driven returns more than any amount of chart refinement on the merchant side.
How does fabric stretch affect size conversion accuracy?
A measurement-based chart only tells half the story if it ignores what the fabric does once it’s on a body. A rigid denim jacket and a ribbed jersey top can carry the same chest measurement on the label and fit completely differently, because one has essentially zero give and the other stretches several centimetres under normal wear.
This is where fit style needs to sit alongside the raw numbers. A garment marketed as “oversized” or “relaxed” is deliberately cut with several centimetres of extra room built into every measurement, so converting its size using the same logic you’d apply to a “slim fit” version of the same product will mislead the buyer even if every number in the chart is technically correct. Compression wear and swimwear sit at the opposite extreme: they’re designed to fit smaller than the body’s actual measurements, and a size chart that doesn’t flag this explicitly will generate returns from buyers who sized up unnecessarily.
The practical fix is to add a stretch and fit descriptor alongside every converted chart, not just the numbers. A simple category label, rigid, moderate stretch, or high stretch, paired with a fit descriptor, slim, regular, or oversized, gives shoppers the context that raw centimetres can’t provide on their own. Suppliers rarely include this in their raw data, so it’s typically something you add during the normalisation stage rather than something the AI transformation step can infer from a spreadsheet alone. Skipping this step is one of the more overlooked reasons technically accurate size charts still produce fit complaints.
What are the common challenges in clothing size conversions?
The most persistent problem isn’t converting units, it’s that “size charts” from different suppliers rarely mean the same thing even when they use the same label. A supplier’s “size M” chest measurement can vary by three or four centimetres from another supplier’s “size M” in the same category, and that gap is invisible until a customer complains.
Regional sizing systems compound this. UK and US sizing for women’s clothing often use different numbering entirely, EU sizing runs on its own scale again, and Japanese and Korean sizing frequently correspond to smaller actual body measurements than their nearest Western label suggests, even when the number looks similar on paper. A size “L” imported without adjustment from a Korean supplier can run noticeably smaller than a Western customer expects, and no amount of unit conversion alone fixes that, because the discrepancy isn’t about centimetres versus inches, it’s about where each system draws its size boundaries.
Data quality is the third recurring issue. Supplier listings imported in bulk often have missing fields, inconsistent decimal formatting, or measurements copied from a different variant entirely. Left unchecked, inconsistent supplier data becomes the single largest contributor to sizing-related returns once a catalogue scales past a few hundred SKUs, simply because errors that were manageable at ten products multiply fast at a thousand.
How do you read body measurements versus garment measurements?
Confusing these two is the single most common size-chart reading error, and it’s worth explaining clearly on every product page rather than assuming customers already know the difference.
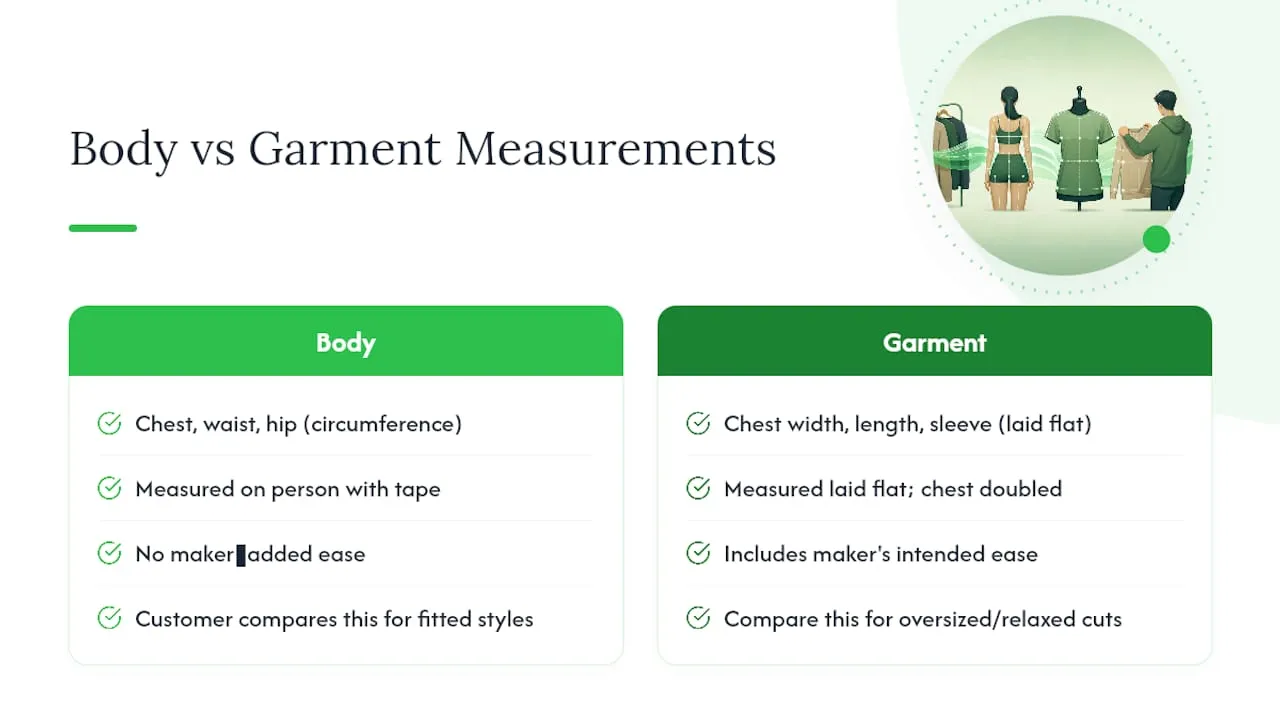
Body measurements describe the person: chest circumference, waist circumference, hip circumference, taken directly on the body with a tape measure. This is what a customer measures on themselves at home.
Garment measurements describe the item as laid flat: chest width (which needs doubling to get circumference), body length from shoulder to hem, sleeve length from shoulder seam to cuff. These numbers already include the maker’s intended ease, the deliberate extra room built in for comfort and movement.
A chart that only lists garment measurements without clarifying this leads buyers to compare their own body measurement directly against a garment number that already has ease built in, and the mismatch shows up as “this runs small” complaints even when the garment is sized correctly. The clearest size charts show both figures side by side, body measurement ranges next to their corresponding garment measurements, with a short note explaining which one the customer should compare against their own tape-measure reading. For fitted styles, encourage comparing against body measurements. For oversized or relaxed cuts, the garment measurement matters more, since that’s what actually determines the silhouette.
What tools exist for manual and automated size conversion?
Manual conversion still works for small catalogues, a handful of SKUs, a spreadsheet, and a merchant with the patience to cross-check every row by hand. It doesn’t scale, and it’s where most of the return-rate problems in dropshipping actually start, because manual entry is where transcription errors creep in.
At the plug-and-play end, several Shopify apps built around size charts and AI fit finders now offer import and export, unit conversion, and AI-assisted chart creation as standard features. These illustrate the building blocks a merchant should expect from any conversion tool: parsing a spreadsheet or screenshot into structured data, applying conversion rules automatically, and surfacing a fit-recommender widget on the product page. Fit-recommender quizzes work well as a layer on top of a chart, not a replacement for one; they still depend entirely on the accuracy of the underlying measurement data to give a useful recommendation.
For merchants running bulk catalogues rather than a handful of listings, the more relevant question is whether the tool handles the full pipeline, ingestion, normalisation, chart generation, and export, or just one stage of it. A technical guide to unit localisation at the theme level is useful if you’re handling conversion inside Shopify’s Liquid templates directly rather than through an app. For catalogues in the thousands of SKUs, an integrated AI SaaS platform that combines size conversion with the rest of the product-page generation process, copy, images, export, tends to save more time than stitching together several single-purpose apps.
Which international size systems does your catalogue need to handle?
Every catalogue selling beyond one country runs into the same core systems, and they don’t convert cleanly into each other through a simple formula. US sizing for women runs roughly 0 to 20 for ready-to-wear, with men’s shirts typically sized by neck and sleeve length in inches. UK sizing looks superficially similar to US numbering but frequently runs two sizes apart for women’s clothing, so a US size 8 is commonly a UK size 12. EU sizing uses a different scale entirely, often numbered in increments of two starting around 34, and it’s used across most of continental Europe with only minor regional variation.
Japanese sizing tends to run smaller across the board relative to Western measurements at the same numeric label, reflecting different average body proportions rather than a simple unit shift. Korean sizing follows a broadly similar pattern to Japanese sizing but uses its own numbering convention, often centimetre-based for height and bust together. Chinese sizing varies more by manufacturer than the other systems, since it’s less standardised across brands, which is precisely why supplier-provided Chinese size labels need independent verification more than any other region’s.
None of these systems convert into each other through a fixed offset that works across every garment category. A conversion table that works for women’s dresses won’t necessarily hold for men’s outerwear, because ease and cut conventions differ by category as much as by region. This is the core reason canonical measurement data, stored in one unit and mapped outward to each label, holds up better at scale than trying to maintain six separate labelled charts that all have to be kept in sync by hand.
Koen’s perspective: three rules from scaling product pages
Generic labelled sizes are a trap. “Medium” means something different on every supplier’s page, so the only chart worth building is one anchored to real measurements, not a label someone else assigned.
Automation without a QA loop just scales your mistakes faster. A small human check on the first pilot batch catches mapping errors while they’re cheap to fix, before they’ve been copied across a few thousand variants.
The SEO argument gets underrated. Unique, variant-specific copy paired with a genuinely accurate size chart is one of the few content signals that’s both hard for a competitor to copy and hard for Google to dismiss as duplicate. Combined with multi-language product pages, it’s a stronger differentiator than most merchants give it credit for.
— Koen
Start a size conversion pilot with EcomEye
An integrated AI SaaS platform advantage over patching together several single-purpose apps is that size conversion, product copy, and images all come out of the same import, so a supplier link becomes a published Shopify page without four separate tools passing data back and forth.
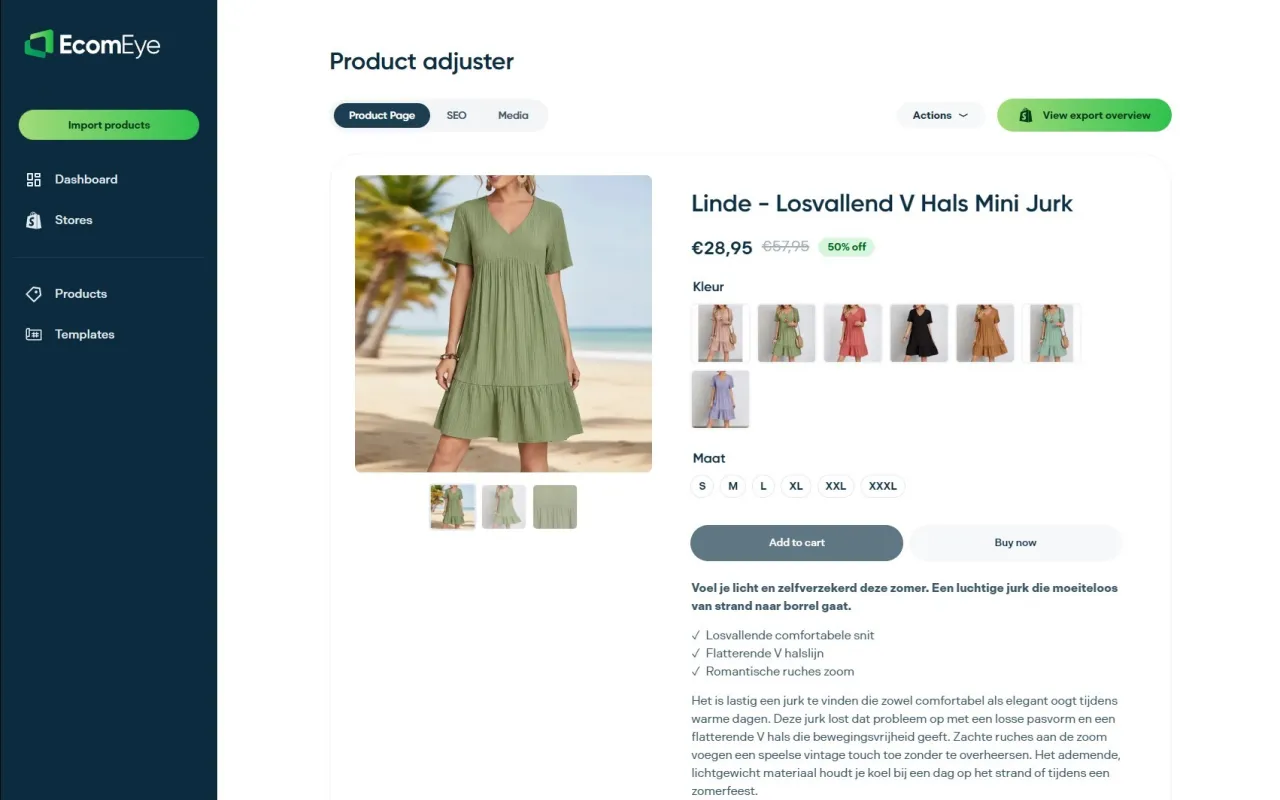
Start with the AI product description generator on a pilot batch of AliExpress or competitor imports, then run the same batch through the AI product image generator to get consistent variant imagery alongside the converted size data. The sensible way in is small: pick 50 to 200 SKUs, run them through the full pipeline, check the output against your own measurements, and watch return rate for a week before deciding whether to push the rest of the catalogue through. A free trial batch is enough to see whether the output holds up against your own QA standards before you commit a full store to it.
Sources
A few resources go deeper into the mechanics covered here, from theme-level unit handling to catalogue-wide upload workflows.
- AI-powered product pages are lifting conversion rates by 34% – Online Store News
- Clothing dropshipping: a complete guide for 2026 (PDF included)
- AI product description generation for e-commerce | SEOKRU
- How to solve sizing issues in clothing dropshipping – PB Fulfill
FAQ
What is the fastest way to convert clothing sizes in bulk for Shopify?
Run supplier data through a canonical measurement table, apply fixed conversion and rounding rules, then export via bulk CSV or API. Tools like EcomEye automate this alongside product copy and image generation in one pass.
Should I trust supplier size charts from AliExpress or Amazon?
No. Supplier charts are frequently inconsistent even within the same product category, so building your own measurement-based chart is the more reliable approach.
How many SKUs should a size conversion pilot include?
Between 50 and 200 SKUs gives enough volume to catch mapping errors without risking your whole catalogue, a pattern consistent with broader AI pipeline pilot recommendations.
Does accurate size conversion actually reduce returns?
Yes, when paired with attribute audits before automation runs. Accurate, complete size data alongside AI-generated pages has been linked to conversion lifts of up to 34% on affected product pages.
Can size conversion be automated end to end without manual review?
Not safely at first. A short human QA loop on the initial pilot batch catches supplier data errors before they scale across thousands of variants, which costs far less than fixing returns after launch.
Ready to boost your product pages?
Generate high-converting, SEO-optimized product pages in bulk using AI automation used by e-commerce experts.
No credit card required